

Understanding Qutex Trading: Key Insights for Indian Traders
Explore Qutex Trading platform features, fees, and security 🔒 to help Indian traders make informed choices 🇮🇳. Compare brokers and get tips for success.
Edited By
Thomas Gray
Bollinger Bands are widely used by traders in Indian markets to gauge volatility and spot potential price moves. However, simply applying default settings—like the 20-day moving average with 2 standard deviations—won't always yield reliable signals. Different market conditions or asset classes often require tailoring these parameters to get a clearer edge.
Selecting the best Bollinger Band settings involves balancing sensitivity and noise. Narrow bands might capture minor price shifts but produce false signals, while wider bands reduce noise but may miss early trend changes. For example, intraday traders dealing with the volatile Nifty index might prefer a shorter moving average period combined with tighter bands to act on swift movements. On the other hand, long-term investors leaning on blue-chip stocks like Reliance Industries may opt for broader settings to avoid overreacting to short-term fluctuations.

In this article, we'll break down how to adjust moving average lengths and deviation multipliers to suit your trading style and market conditions. By understanding these adjustments, you can improve your timing for entry and exit, reduce whipsaw losses, and navigate India's diverse market segments more confidently.
Knowing when and how to fine-tune your Bollinger Bands can turn a standard indicator into a powerful tool tailored for Indian equities, commodities, or currency markets.
Here’s a quick summary of factors to consider:
Moving Average Period: Shorter periods (10-15 days) react faster but are noisy; longer ones (20-50 days) smooth price data but respond slower.
Standard Deviation Multiplier: Commonly set at 2, adjusting it to 1.5 or 2.5 affects band width, influencing sensitivity.
Market Volatility: Adjust bands to widen during high volatility phases, like earnings seasons or RBI policy announcements.
Asset Type: Stocks, commodities, and forex pairs behave differently—settings should reflect their unique volatility patterns.
Understanding these basics sets the stage for effective use of Bollinger Bands that complement your trading objectives across the Indian markets.
Grasping the basics of Bollinger Bands is essential for anyone serious about using them effectively in trading. These tools give a snapshot of market volatility and potential price levels, helping you make more informed decisions in Indian stocks or derivatives.
Bollinger Bands consist of three lines plotted over price data. They help visualise price movement relative to recent trends and volatility. Traders use them to spot when a stock might be overbought or oversold, capturing opportunities across different timeframes. For instance, in NSE stocks, spotting prices touching the upper band can hint at a possible pullback, while nearing the lower band may indicate a bargain.
The middle band is usually a simple moving average (SMA), commonly calculated over 20 days. This average smoothes out daily price fluctuations to reveal the prevailing trend. For example, if the middle band for a Sensex stock is trending upward consistently, it suggests a bullish phase. Conversely, a decline points to potential weakness.
The upper and lower bands sit above and below the SMA, positioned typically two standard deviations away. This distance adjusts dynamically, widening when markets are volatile and narrowing during calm phases. In practice, if the bands widen sharply for an Nifty security due to high volatility ahead of earnings, it warns traders to expect bigger price swings.
Band width directly reflects market volatility. When the bands contract, it signals low volatility and often precedes a significant price breakout. Conversely, expanding bands indicate heightened volatility, which may produce false signals. Indian traders observe this during monsoon seasons or festival periods when markets can be choppy or quiet.
Price action near the bands can reveal momentum shifts. When prices repeatedly hit the upper band, the asset may be overbought and due for a correction. Similarly, touches at the lower band suggest oversold conditions and possible rebounds. However, breakout traders watch decisive moves beyond the bands as signs of emerging trends, indicating strong directional bias rather than reversal.
Understanding these components helps Indian traders adapt Bollinger Bands sensibly, balancing between signal sensitivity and noise. Adjusting settings with these insights keeps your strategy tuned to market reality, not guesswork.
When working with Bollinger Bands, understanding common settings helps traders gauge market behaviour with better clarity. These default parameters offer a baseline structure that suits various trading styles but can be tweaked for specific conditions. Knowing how each setting impacts band behaviour aids in making informed decisions rather than relying solely on preset values.
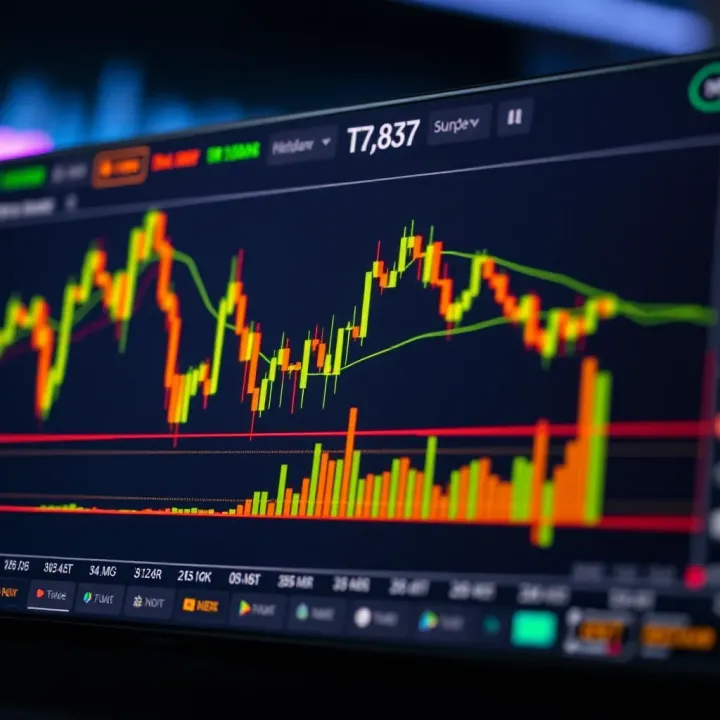
The most widely used Bollinger Band setting is a 20-period Simple Moving Average (SMA) combined with a band width set to 2 standard deviations. This means the middle band uses the average closing price over 20 periods, while the upper and lower bands represent two standard deviations away from this average. Such a setup helps capture roughly 95% of price action assuming normal distribution, offering a balanced view of volatility.
This standard remains popular because it adapts well across different market scenarios while providing a good mix of sensitivity and reliability. For example, a trader in the NSE may notice that this setting flags overbought or oversold conditions effectively for commonly traded stocks like Reliance Industries or HDFC Bank. It also works well as a foundation before making adjustments for faster intraday or slower long-term strategies.
Shorter periods, say 10 or 15, make Bollinger Bands more responsive, capturing quick price fluctuations common in fast-moving markets. Day traders or scalpers often prefer these settings to react promptly to intraday volatility. Such responsiveness can signal reversals or breakouts earlier but risks more false alarms during choppy moves.
Conversely, longer periods like 30 or 50 smooth out the bands and reduce noise. This approach benefits swing traders and long-term investors focused on steady trends in Indian equities or derivatives. For instance, a 50-period SMA might help filter out day-to-day volatility in stocks like Infosys or Tata Steel, giving clearer confirmation signals. However, it may delay trade entry or exit decisions.
Lowering the standard deviation multiplier to values like 1.5 narrows the bands, making them react to smaller price swings. This sensitivity helps spot potential breakouts from consolidation phases often seen in mid-cap stocks. The downside is these narrow bands generate more false signals, so combining them with volume or momentum indicators is advisable.
Increasing the multiplier to 2.5 or 3 widens the bands, filtering out minor price fluctuations and noise. This setting suits volatile markets or assets where false triggers can be costly. For example, derivative traders dealing with Nifty options may prefer wider bands to avoid whipsaws. Wider bands also help identify strong trend continuation when price moves decisively outside the bands.
Choosing the right combination of period length and deviation multiplier depends on your trading style, asset volatility, and market conditions. Start with standard settings and fine-tune them as per your observation and strategy needs.
Choosing the right Bollinger Band settings depends heavily on your trading style. Each style—whether swing trading, day trading, or long-term investing—has distinct goals and timeframes, so the indicator must align accordingly. Tailoring settings helps strike a balance between signal sensitivity and filtering out noise, enhancing decision-making.
Swing traders aim to capture price moves that last several days to a few weeks. Here, balancing responsiveness and signal reliability becomes key. Too short a period leads to frequent false signals, while too long makes the bands lag and miss timely opportunities. Setting the moving average to a moderate length, like 15 to 20 periods, maintains sufficient responsiveness without being excessively sensitive.
For swing trades, example parameters often include a 20-period Simple Moving Average (SMA) combined with standard deviation multipliers between 1.8 and 2. This setting helps identify periods when price touches or swings near the bands, signalling potential reversals or continuation points. For instance, an Nifty stock consistently bouncing off the lower band with increasing volume may hint at a rebound, giving swing traders a practical entry point.
Day traders require quicker responses due to rapid price changes within the session. Faster moving averages—often 10 periods or lower—help capture swift momentum shifts. Such settings produce tighter bands that react promptly to intraday volatility, essential for scalping or short trades in volatile stocks like those in the metal or banking sectors.
Using Bollinger Bands alongside volume or momentum indicators like the Relative Strength Index (RSI) or Moving Average Convergence Divergence (MACD) boosts confidence in signals. For instance, a price touch near the lower band coinciding with an RSI below 30 could indicate strong intraday oversold conditions, suggesting a potential bounce. This combined approach helps reduce false breakouts common in fast markets.
Long-term investors look to avoid noise from short-term fluctuations. Hence, they prefer longer period SMAs, such as 50 or 100 periods, which smooth out daily ups and downs. This reduces false signals and better captures sustained trends in large-cap stocks or index ETFs.
Bollinger Bands also assist in trend confirmation for long-term investing. For example, when a stock like Reliance Industries consistently rides the upper band over months, it suggests strong bullish momentum. Investors can use this to hold positions confidently or add on dips near the middle band, which acts as dynamic support.
Customising Bollinger Band settings for your trading style improves accuracy and timing, making this tool more reliable across different market scenarios.
By adjusting the bands to your approach, you gain clearer entry and exit signals aligned with your investment timeframe and risk appetite.
Adjusting Bollinger Band settings according to market conditions is key to using this tool effectively. The standard parameters may not always suit every environment, especially in markets like India's, where volatility swings between explosive and subdued phases. Traders benefit by tweaking the band’s sensitivity, thus avoiding false signals and capturing genuine price movements.
Expanding standard deviation to reduce whipsaws: During high volatility phases, price movements become erratic, leading to frequent crossings of Bollinger Bands. Using the typical 2 standard deviation multiplier might cause many false breakouts, resulting in poor trade signals or "whipsaws". Increasing the standard deviation to 2.5 or 3 widens the bands, filtering out minor and volatile price swings and focusing only on significant movements. This tactic helps traders avoid exits or entries triggered by market noise, especially relevant during events like budget announcements or RBI policy changes, when volatility spikes unexpectedly.
Recognising wider band breaks: In volatile conditions, a sharp price move breaking the bands often signals strong momentum rather than a reversal. Wider band breaks usually coincide with key market shifts. For example, during the demonetisation phase in India, many stocks witnessed wide Bollinger Band breaks signalling trend continuation instead of exhaustion. Traders who spot these breaks can better position for strong directional plays, rather than relying on standard overbought or oversold assumptions.
Narrow band settings to anticipate breakouts: When markets enter consolidation or low volatility, bands contract tightly. Narrow band settings—using a lower standard deviation such as 1.5 instead of 2—can be more useful here. These tighter bands highlight decreasing volatility more clearly and help traders anticipate imminent breakouts. Adjusting period length to shorter spans, like 10 or 15 days, captures these subtle shifts quicker, an approach useful during range-bound phases in NSE or BSE stocks.
Examples from Indian markets during sideways movement: Indian markets often linger in sideways phases before major rallies or corrections. For instance, the Nifty 50 during parts of 2023 displayed prolonged narrow Bollinger Bands. Traders adjusting bands to narrower settings were able to spot breakout opportunities early before sharp upward or downward moves. Sectors like IT and FMCG, which sometimes move sideways amid broader trends, also showed clearer signals when band parameters were fine-tuned for low volatility.
Customising Bollinger Band settings based on market volatility helps minimise false signals and improves trade timing, making it a practical tool for navigating India's often unpredictable markets.
For Indian traders, mastering Bollinger Bands means going beyond just understanding their basic settings. Practical application tailored to Indian markets, asset types, and trading hours plays a significant role in effective decision-making. These tips help you use Bollinger Bands better alongside other tools, manage risks smartly, and adjust settings based on the unique behaviour of Indian equities and derivatives.
RSI is a momentum indicator that gauges the speed and change of price movements, usually over a 14-day period. When paired with Bollinger Bands, RSI can confirm whether an asset is overbought or oversold as it approaches the outer bands. For example, if a stock in NSE touches the upper Bollinger Band and RSI is above 70, that’s a strong sign of a potential reversal or pullback. This combo reduces false signals and helps you time entries and exits more effectively.
MACD tracks the relationship between two moving averages and highlights momentum shifts and possible trend changes. Using MACD along with Bollinger Bands can give you a clearer entry or exit signal. For instance, if the price is breaking above the upper Bollinger Band while MACD crosses above its signal line, it suggests a strong bullish trend. Indian traders often use this pairing to refine their swing or intraday strategies, as it balances volatility insights with trend strength.
Volume acts as the fuel behind price movements. Watching volume spikes alongside Bollinger Band breaks makes breakout signals more trustworthy. In Indian markets, where liquidity varies across stocks, volume confirmation matters. For example, if a BSE stock breaks above the upper band on high volume, it’s more likely to sustain the move, while low volume breakouts tend to fail. Combining volume data from NSE and BSE enhances your confidence in volatility-based trading signals.
Placing stop losses near the Bollinger Bands can protect profits and limit losses effectively. When you buy near the lower band, setting a stop loss a few points below that band acts as a safety net in case of further price falls. Conversely, if you enter a short near the upper band, you can place the stop loss slightly above it. This method works well in Indian markets, where sudden volatility can occur during earnings announcements or global cues.
Indian markets sometimes witness sharp moves due to foreign fund flows, geopolitical news, or policy changes. Bollinger Bands indicate when the market is squeezing tight and volatility may expand soon. Traders should be alert at such times and consider wider stop losses or reduce positions to avoid getting stopped out prematurely. Position sizing and using a combination of Bollinger Bands with other volatility metrics can help defend your trades against such surprises.
Indian market hours are fixed (9:15 am to 3:30 pm IST for NSE/BSE), and liquidity tends to concentrate in specific periods such as the opening, closing, and post-lunch sessions. Adjusting Bollinger Band periods to shorter lengths during these high-activity phases can pick up quick price fluctuations better. For derivatives like Nifty futures, where volatility is often higher, tweaking the standard deviation multiplier can reduce false breakouts.
Not all Indian stocks behave similarly—small-cap shares tend to be more volatile than large-cap giants like Reliance or TCS. Adapt Bollinger Band settings accordingly. For high-volatility assets, using wider bands (e.g., 2.5 standard deviations) helps filter noise, whereas stable blue-chips work well with the standard 2 deviation bands. This adaptive approach supports better timing in both equity and derivatives trading across Indian markets.
Combining technical tools with local market insights allows Indian traders to make Bollinger Bands truly effective for their trading goals.
Explore Qutex Trading platform features, fees, and security 🔒 to help Indian traders make informed choices 🇮🇳. Compare brokers and get tips for success.

📈 Master Quotex with proven strategies! Learn risk management, market analysis, and build a solid trading plan to boost your success and confidence.
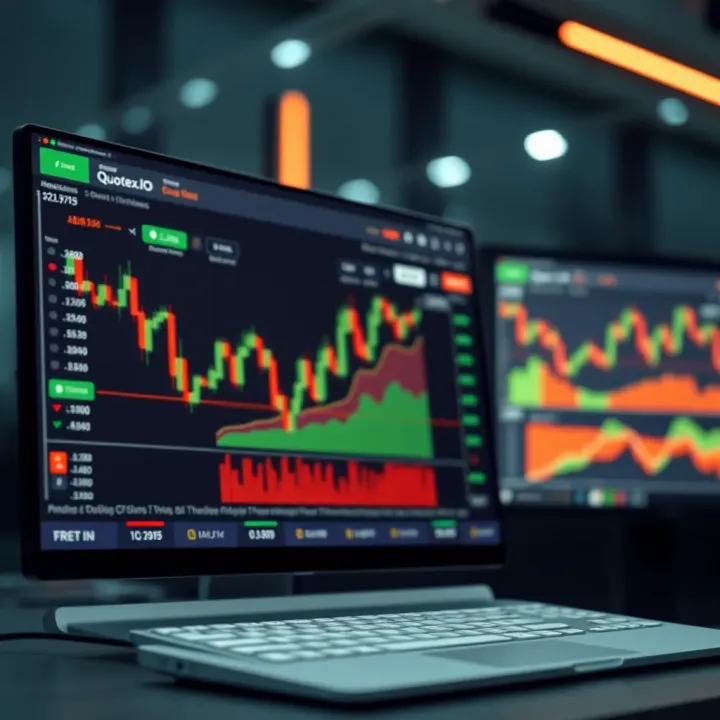
Explore Quotex.io in detail 📊—features, trading options, security, fees, and support—all tailored for traders in India and beyond. Make informed decisions!
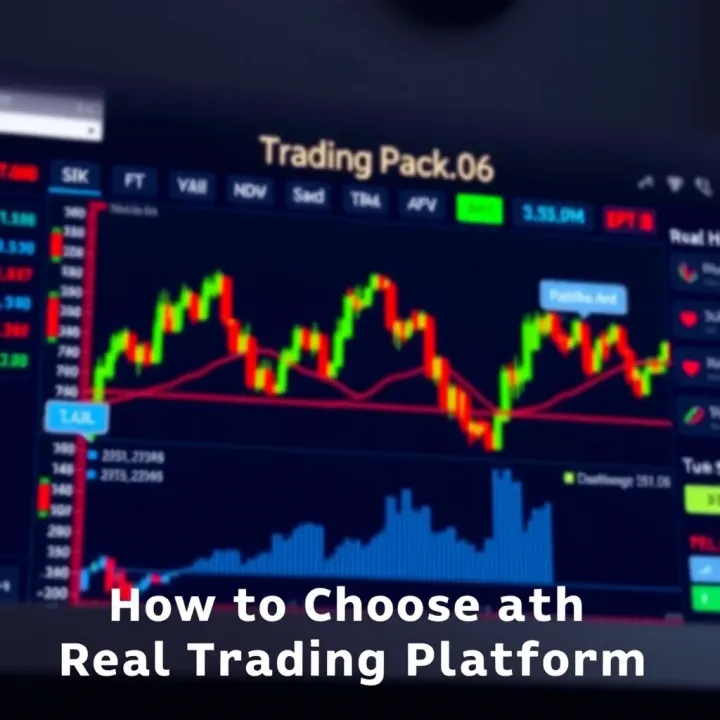
Discover how to pick the right trading platform in India 📈 Learn key features, regulatory tips, and avoid common risks for smarter stock, forex, and commodity trades 🚀
Based on 15 reviews