
Understanding Quotex for Indian Traders
Explore Quotex trading platform🌐 made simple for Indian users🇮🇳. Learn features, setup, risks & benefits to trade smartly online📈💡
Edited By
James Turner
TradingView has become a popular platform among Indian traders for analysing market trends and making informed investment decisions. With its user-friendly interface and wide range of charting tools, it suits both beginners and seasoned investors tackling the dynamic Indian stock market.
The key advantage of TradingView lies in its real-time data access and diverse chart types, which Indian traders can personalise to track stocks listed on exchanges like BSE and NSE effectively. From candlestick to line and bar charts, each offers unique insights into price behaviour.
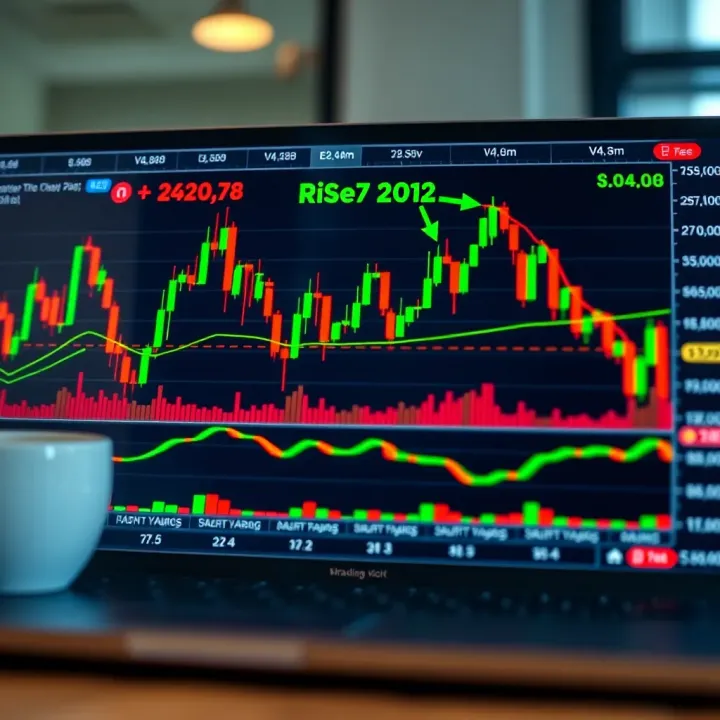
To trade smart in India’s volatile markets, mastering chart reading is essential. TradingView’s features empower you to spot patterns early and plan your entry and exit points with greater confidence.
Chart analysis helps decode market sentiment without relying solely on news or reports. By reading price movements and volumes, traders can anticipate potential shifts before they show up in fundamentals.
For instance, spotting a 'head and shoulders' pattern might alert you of a potential downtrend in an IT stock like Infosys, while a breakout above resistance on a Reliance Industries chart could indicate an uptick opportunity.
TradingView supports Indian exchanges and offers indicators popular among local traders, such as volume weighted average price (VWAP) and RSI, which help confirm price trends and reversals.
Users can customise watchlists with Indian stocks, set price alerts on specific scrips, and even share trading ideas within a community that understands local market nuances.
Organising your workspace effectively can speed up decision-making during volatile sessions, such as during quarterly results or RBI monetary announcements.
Getting started is straightforward:
Choose your preferred chart type (candlestick is common among intraday traders).
Add relevant indicators, but avoid cluttering with too many.
Set timeframes that match your strategy, be it daily, hourly, or minute charts.
Once set, save your layout for easy access next time.
Mastering TradingView’s chart analysis tools gives you an edge to decode the markets faster and trade with clarity amid India’s fast-changing economic landscape.
Starting with TradingView charts is essential for anyone serious about trading or investing in Indian markets. These charts serve as the foundation of technical analysis, helping traders identify patterns, trends, and potential entry or exit points. By understanding the basics of TradingView charts, you reduce guesswork and increase the chances of making informed decisions.
TradingView has gained popularity among Indian traders due to its user-friendly interface and accessibility. Unlike some traditional platforms, TradingView works seamlessly on both desktop and mobile, which is crucial for the busy trader juggling work and market watch. It offers real-time data integration for NSE (National Stock Exchange) and BSE (Bombay Stock Exchange), which means Indian traders can track their favourite stocks with up-to-date price movements.
Another reason for its preference is the vast library of indicators and drawing tools with easy customisation. Indian retail investors can experiment with moving averages, Relative Strength Index (RSI), and other indicators without paying extra, thanks to TradingView's freemium model. Plus, the social and community features allow traders to learn from peers, share ideas with those familiar with the market nuances, improving their trading edge.
Accessing TradingView is straightforward in India as it's a web-based platform requiring no special downloads. Traders simply sign up online and receive immediate access to a range of charts. The platform supports Indian market hours by default, making day trading or investing convenient without manual adjustments.
That said, some advanced features like extended access to indicators or multi-chart layouts require a subscription—most traders find the basic free version sufficient to start. Since TradingView uses low data and is responsive, it also works well even on average mobile internet connections common in many tier-2 and tier-3 Indian cities.
Line charts display a simple line connecting closing prices over a set period. While basic, they offer a clear view of price direction without distractions. For new traders or those focusing on long-term trends (like those investing in Nifty 50 ETFs for retirement), line charts help highlight overall momentum without fuss.
This simplicity means you won't see daily highs or lows, but a neat, straightforward trend line that can tell when the market is generally going up or down.
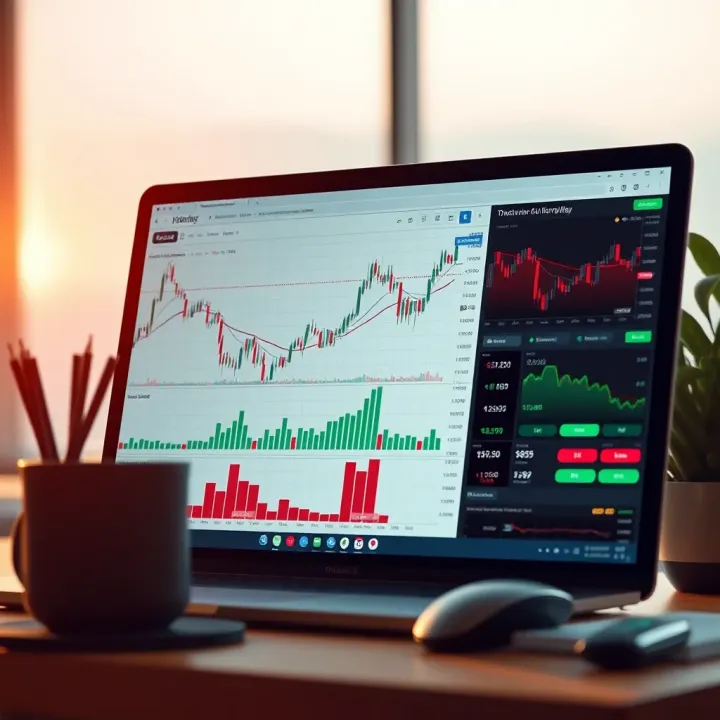
Candlestick charts are by far the most popular on TradingView because they convey more detail than line charts. Each candlestick reflects the opening, closing, high, and low prices for a given timeframe, helping traders gauge market sentiment instantly. For instance, a green candle with a long body shows strong buying pressure, a valuable signal for traders spotting breakout opportunities in bluechip stocks like Reliance or HDFC Bank.
Candlestick patterns like 'hammer', 'doji', or 'engulfing' can indicate reversals or continuations, widely used by Indian traders to time entries and exits. These patterns, combined with volume data, can make trading less hit-and-miss.
Bar charts resemble candlesticks but focus more on the high, low, open, and close without colour-coded bodies, which appeals to traders who prefer minimal visual cues. They provide precise price movements but are less popular among beginners.
Heikin Ashi charts smooth out price action, filtering noise to highlight trends better. This makes them useful for trend followers in the Indian markets, particularly during volatile sessions when Nifty or Sensex experiences sharp swings. Heikin Ashi charts help avoid false signals by showing a calmer price trend, enabling traders to hold positions longer without panic selling.
Choosing the right chart type depends on your trading style and goals. Beginners may start with line or candlestick charts, while more advanced traders often use Heikin Ashi alongside other methods to refine their strategies.
By understanding these different chart types, Indian traders can pick what suits them best and build a solid analysis foundation on TradingView.
Customising charts is essential for traders and investors to interpret market data efficiently and act swiftly. Tailoring chart settings to your trading style helps filter noise, focus on relevant details, and spot opportunities specific to your goals. For Indian traders, where market volatility can be high, having clear and personalised charts can mean the difference between timely decisions and missed trades.
Choosing the right timeframe matches your trading strategy with the market rhythm. For example, day traders operating on NSE or BSE often use shorter timeframes—5 minutes to 15 minutes—to catch intraday price moves. On the other hand, investors might prefer weekly or monthly charts to follow long-term trends and avoid reacting to daily fluctuations. Selecting timeframes thoughtfully helps you avoid information overload and keeps your analysis focused.
Saving multiple chart layouts is handy when you juggle different trading styles or track various instruments. You could save one layout showing intraday charts of Sensex stock components, and another with monthly views of heavyweight Nifty stocks. TradingView’s option to store and recall these layouts saves time and helps maintain a consistent approach without resetting preferences every day.
Using visual tools like trendlines and channels allows you to mark support and resistance areas clearly. For instance, drawing a rising channel on Tata Steel’s chart can highlight its upward momentum, while trendlines help you spot potential breakouts or reversals. Shapes like rectangles or ellipses help focus attention on price zones or consolidations, making your chart analysis more intuitive.
Adding notes and comments directly on charts offers a quick way to record observations or strategies for later review. Imagine marking a Fibonacci retracement level on Reliance Industries and noting why it matters to your trading plan. These annotations come handy during post-market reviews or when sharing ideas with trading groups. They create a personalised learning trail that improves with experience.
A well-customised chart acts like your market compass, guiding you through complexities with clarity and speed.
Ultimately, mastering these Customising tools on TradingView enriches your analysis, helping you navigate Indian markets with confidence and precision.
Technical indicators help traders uncover trends, momentum, and potential reversal points that are not obvious from price movements alone. On TradingView, applying these indicators offers a practical edge to Indian traders because the platform supplies up-to-date data from NSE and BSE, enabling real-time analysis tailored for local market behaviour. Proper use of technical indicators can support timely entry and exit decisions, complementing other chart tools.
Moving averages smooth out price data, showing trends over a set period. The Simple Moving Average (SMA) calculates the average closing price over a specific number of days, while the Exponential Moving Average (EMA) gives more weight to recent prices, making it more responsive. Indian traders often use the 50-day and 200-day moving averages to identify trend direction in stocks like Reliance Industries or HDFC Bank. For instance, when the 50-day MA crosses above the 200-day MA, it suggests a bullish momentum, a setup many traders watch for buying opportunities.
RSI measures the speed and change of price movements on a scale from 0 to 100, highlighting overbought or oversold conditions. Typically, an RSI above 70 indicates overbought, while below 30 suggests oversold. For Indian markets, this helps spot when a stock like Infosys might be due for a correction or rebound. RSI is especially handy during volatile periods, such as before quarterly results or RBI announcements, as it provides cues on potential price reversals.
The Moving Average Convergence Divergence (MACD) shows the relationship between two EMAs, typically the 12-day and 26-day. The MACD line crossing above the signal line points to bullish momentum; crossing below signals bearishness. Indian traders commonly use the MACD to confirm trade signals, particularly for volatile stocks on the NSE. For example, during earnings season, an MACD crossover on a stock like Tata Motors might signal a strong move ahead, helping traders time their buys or sells.
Volume indicates the number of shares traded in a given period and confirms the strength of price moves. On TradingView, volume bars help Indian traders validate breakouts or breakdowns on indices like Nifty 50. For instance, a breakout with rising volume suggests genuine interest and sustainability, while low volume may signal a false move. Combining volume with price indicators helps avoid getting trapped in fake breakouts.
Support and resistance identify price levels where buying or selling pressure repeatedly emerges. Indian traders often mark horizontal lines on charts of stocks like ICICI Bank to track these levels, spotting entry points near support or exits near resistance. When combined with technical indicators like RSI or moving averages, these levels improve decision-making. For example, an RSI oversold signal near a strong support level offers a better chance of a successful trade.
Using a mix of indicators on TradingView adds layers of confirmation, helping Indian traders reduce risk and improve timing. This blend of tools adapts well to local market conditions where volatility and volume can be unpredictable.
By mastering these indicators and their combinations, traders can sharpen their analysis and approach Indian markets with greater confidence.
TradingView’s advanced charting features are key for serious Indian traders looking to sharpen their market moves. These options add precision and real-time responsiveness, helping traders pick entries, exits, and opportunities faster. Understanding these tools is especially useful when dealing with volatile instruments like Sensex or Nifty stocks, where timing can mean the difference between profit and loss.
Setting price alerts for Sensex or Nifty components lets you stay ahead without glued eyes on the screen. For example, if Reliance Industries crosses a key support level like ₹2,500, an alert can notify you immediately. This allows quick action, either to book profits or cut losses, which matters a lot in the fast-moving Indian market.
Using indicator-based alerts further refines your strategy. You can trigger alerts when the Relative Strength Index (RSI) moves beyond 70 or dips below 30, signalling potential overbought or oversold conditions. This hands-off approach ensures you don’t miss critical moments, even when multitasking or away from your trading desk.
Comparing different stocks or indices on TradingView simplifies spotting relative strength or weakness. For instance, juxtaposing Infosys and TCS charts can highlight which IT stock is showing a stronger uptrend. This helps traders diversify or choose sector leaders dynamically.
Similarly, tracking intraday and long-term charts side by side aids in aligning short-term actions with broader market trends. You could monitor a 15-minute chart for immediate trade setups while keeping an eye on the daily chart for the prevailing trend. This split view prevents chasing false signals and supports more disciplined trading.
Advanced chart features in TradingView provide Indian traders with tools to automate monitoring and visualise multiple market angles easily. Using alerts and multi-chart layouts, you stay timely and informed for better decisions.
Set price alerts near key levels identified through support and resistance.
Use indicator alerts to confirm trend changes without constant chart watching.
Open multiple charts to compare sectors, stocks, or timeframes simultaneously.
Mastering these advanced tools improves efficiency and trading outcomes in India’s vibrant equity markets.
TradingView's charting tools become far more effective when integrated into practical trading strategies suited to Indian markets. This integration helps traders make timely, data-driven decisions rather than relying solely on instinct or news headlines. Indian stocks and indices like the Nifty 50 and Sensex have unique market rhythms influenced by domestic factors such as RBI announcements, monsoon impact on sectors like agriculture, and policy changes. TradingView bridges these market peculiarities by offering live data feeds and sophisticated analysis tools.
Using TradingView alongside Indian brokers and platforms enhances the trader’s experience by providing uninterrupted access to real market data, analysis, and execution. This synergy improves trade accuracy and allows traders to spot opportunities quickly, be it through technical patterns or alerts. Leveraging TradingView's features in Indian contexts ensures strategies stay relevant and effective in volatile markets.
Connecting TradingView charts with NSE and BSE data
TradingView supports integration with National Stock Exchange (NSE) and Bombay Stock Exchange (BSE) data, delivering real-time prices and intra-day charts for Indian stocks. This direct feed makes chart analysis trustworthy since it reflects the actual market movements without lag, crucial for intraday traders and those following fast-moving sectors like IT or pharma.
For example, when Reliance Industries announces quarterly results, traders can instantly see the impact on the chart on TradingView without switching platforms. This avoids delays common with third-party data providers, ensuring you react swiftly to market shifts.
Placing orders through linked brokers
TradingView now allows Indian traders to connect their TradingView account with select brokers such as Zerodha or Upstox. This means you can analyse charts and place orders without leaving the TradingView interface, simplifying your workflow. Instead of toggling between your charting tool and brokerage platform, everything happens in one place.
This feature is especially handy during volatile market hours when a tiny delay can affect trade execution. For instance, tracking a breakout pattern on Tata Motors’ stock and placing a buy order immediately from TradingView helps capitalise on price momentum promptly.
Recognising head and shoulders, double tops
Head and shoulders and double top patterns are reliable reversal signals that Indian traders use to anticipate trend changes. The head and shoulders pattern shows a peak (head) flanked by two smaller peaks (shoulders), signalling a potential drop after an uptrend. Similarly, a double top looks like two peaks at almost the same level and indicates weakening bullish momentum.
These patterns are widely applicable across Indian equities. For example, if Infosys forms a head and shoulders on its daily chart, it often precedes a correction, signalling traders to either exit long positions or prepare for shorting opportunities.
Trading breakouts and pullbacks
Breakouts happen when a stock price moves beyond a key resistance level with volume, suggesting strong buying interest. Pullbacks occur when prices briefly retrace to the breakout level before continuing upward. Indian traders often monitor these setups to enter trades with lower risk.
For instance, a breakout above ₹2,000 in HDFC Bank’s stock on heavy volume can indicate fresh buying pressure. Waiting for a pullback to near ₹2,000 before entering can provide a better risk-reward ratio, helping you avoid false breakouts common in volatile markets.
Accurate chart analysis combined with practical trading patterns on TradingView can considerably improve trade timing and decision-making for Indian traders.
Integrating these features into your trading plan makes TradingView a powerful daily companion for navigating Indian markets with confidence.
Explore Quotex trading platform🌐 made simple for Indian users🇮🇳. Learn features, setup, risks & benefits to trade smartly online📈💡

🔐 Master ExpertOption login with ease! Learn step-by-step process, fix common issues, and secure your trading account. Manage access across mobiles, laptops safely.

Explore the QXBroker app 📱 tailored for Indian traders 🇮🇳 with its user-friendly interface, diverse trading options, solid security 🔒, and reliable support 🤝.
Explore QX Broker for Indian traders: services, platforms, account types, fees, and support. Make informed choices with this detailed guide 📈💼🛡️
Based on 15 reviews