

Understanding QX Trading for Indian Investors
📊 Learn QX trading basics, strategies, risks, and regulations tailored for Indian investors. Get practical tips to trade safely and effectively today!
Edited By
Henry Watson
Chart pattern trading involves identifying specific formations on price charts that can forecast future market movements. Traders use these patterns to make informed decisions, anticipating whether the price will continue in the current direction or reverse. This method combines technical analysis with market psychology, giving insight into buying and selling pressure.
In Indian markets, recognising chart patterns can translate into better timing for entering or exiting trades, which is vital for capitalising on price moves while managing risks. Charts are visual tools, and patterns naturally emerge from fluctuations fueled by supply-demand dynamics, news impact, or investor sentiment.

Common chart patterns include:
Head and Shoulders: Indicates a potential reversal from bullish to bearish trend or vice versa.
Double Top and Double Bottom: Signals strong resistance or support, often preceding trend shifts.
Triangles (Ascending, Descending, Symmetrical): Reflect periods of consolidation before a breakout.
Each pattern carries unique implications. For example, a head and shoulders top on a stock like TCS could suggest upcoming weakness after a sustained rally. Traders watching for this pattern would prepare to exit or short-sell accordingly.
Successful chart pattern trading depends not just on spotting formations, but also on confirming volumes and other indicators like moving averages to reduce false signals.
To trade effectively:
Focus on well-defined patterns on daily or weekly charts.
Confirm breakouts or breakdowns with volume spikes.
Use stop losses just beyond pattern boundaries to limit losses.
Combine patterns with Indian market context—for instance, regulatory announcements affecting sectoral stocks may invalidate patterns temporarily.
Beware of common mistakes such as:
Trading prematurely before pattern completion.
Relying solely on patterns without considering broader market trends.
Ignoring risk management strategies.
Reliable PDF resources from SEBI or reputed Indian technical analysis mentors can help deepen understanding and practical skills.
Understanding chart pattern trading offers a disciplined approach to market analysis, enhancing your ability to anticipate price direction while managing risks pragmatically.
Chart patterns are visual formations traced by price movements on a stock's trading chart. They serve as important tools for traders looking to anticipate future price behaviour based on past market activity. Recognising these patterns helps traders identify potential entry and exit points, improving decision-making in fast-moving markets.
At their core, chart patterns encapsulate collective market sentiment. When a pattern forms, it reflects the tug-of-war between buyers and sellers, revealing underlying market psychology. For example, a 'double bottom' pattern often signals that sellers have run out of steam, while buyers are gaining strength, hinting at a possible bullish reversal ahead.
Chart patterns are specific shapes created by price actions over time, such as triangles, head and shoulders, or flags. Their significance lies in signalling potential trend continuations or reversals. Traders rely on these patterns to make predictions about price movements, rather than just reacting to raw price changes.
For instance, in the Indian stock market, spotting a ‘head and shoulders’ pattern on a Sensex stock chart might warn of an imminent downtrend. Recognising this in time lets traders adjust their positions, potentially reducing losses.
Each pattern mirrors how traders collectively feel about a stock, balancing fear, greed, uncertainty, and optimism. For example, a rising wedge pattern often shows that although prices are going up, buying pressure is weakening, signalling hesitation before a reversal.
This insight allows traders to read beyond numbers, understanding the emotions driving price swings. It is like peeking into the market’s mood, enabling smarter decisions in anticipation rather than reaction.
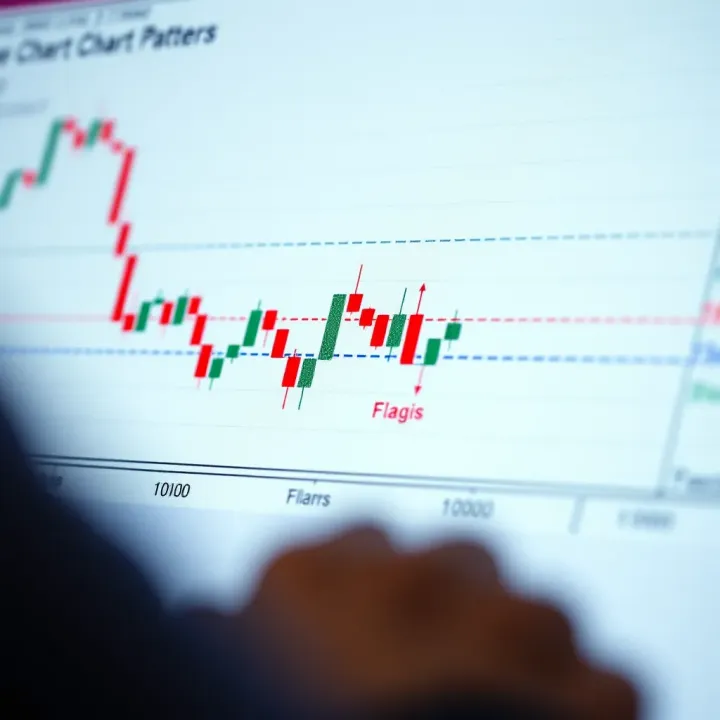
Chart patterns help forecast where prices may head next. By analysing previously formed shapes, traders estimate whether a stock is likely to continue its trend or reverse. This forecast guides strategic choices, such as when to buy, hold, or sell.
For example, a completed ascending triangle typically signals that the price is ready to break upward. Traders observing this formation on Nifty 50 stocks may prepare to buy before the breakout, capturing gains early.
Chart patterns are a vital part of technical analysis, complementing indicators like moving averages and volume trends. Rather than relying on one signal, combining patterns with other tools improves the accuracy of predictions.
In Indian trading platforms like Zerodha or Upstox, traders can overlay pattern recognition with indicators such as RSI or MACD. This layered approach reduces risks by confirming signals across methods, offering a more reliable roadmap for trading strategies.
Understanding chart patterns is essential; they turn raw price data into meaningful signals that reveal market psychology and help predict price movements, enhancing trading decisions.
By grasping the nature and role of chart patterns, traders can navigate Indian markets more confidently — spotting opportunities early and managing risks wisely.
Chart patterns serve as a practical tool for traders to read the market's mood and anticipate price moves. Recognising these patterns can boost your market timing and trade accuracy, which is especially useful in India’s fast-paced exchanges like NSE and BSE. They fall mainly into two categories: reversal patterns that signal a change in price direction, and continuation patterns that suggest the current trend will carry on.
The Head and Shoulders pattern signals a potential trend reversal from bullish to bearish (or vice versa in the inverse version). It looks like three peaks—two smaller ones on either side of a taller middle peak, resembling a person’s head and shoulders. Traders use this pattern to spot when a stock's price is about to fall after a steady rise, making it a clear alert to consider selling or shorting.
For example, if Reliance Industries shares form this pattern after a sustained climb, it might warn traders that the uptrend could end soon. Always look for confirmation, like a break below the neckline (the base line connecting the two troughs). Volume typically falls during the formation and spikes on the break, reinforcing the signal.
Double Tops and Double Bottoms are also key signs of reversals. A Double Top appears as two peaks at roughly the same level and signals a drop after an uptrend. Conversely, a Double Bottom shows two dips at roughly the same level, indicating an upcoming rise.
Say Infosys shares reach a price near ₹1,800 twice but fail to surpass it, forming a Double Top; this suggests selling pressure is strong, and the price may drop. Similarly, a Double Bottom at ₹1,200 points to buying interest stabilising support, hinting at an upward bounce. Confirmation comes when the price crosses the pattern’s support or resistance level with volume support.
Triangles reflect pauses in the market where buyers and sellers battle for control before one side breaks out. An Ascending Triangle has a flat upper resistance line and rising lower support, often leading to bullish breakouts. A Descending Triangle shows a flat lower support with descending resistance, usually bearish. Symmetrical Triangles have both lines slanting towards each other, indicating uncertainty but ready for a breakout in either direction.
For instance, an Ascending Triangle forming in Tata Steel’s chart after a rally could hint at further upside once the price breaks past resistance near ₹1,200. Traders wait for the breakout and volume increase before entering.
Flags and Pennants are short-term continuation patterns that appear after sharp price moves. A Flag looks like a small rectangle slanting against the prevailing trend, while a Pennant is a small symmetrical triangle formed by converging trendlines.
These patterns suggest the market is taking a breather before resuming the direction. For example, HDFC Bank’s stock may surge sharply, then show a small Flag consolidation before pushing higher. Traders use these as entry points, buying near the base of the Flag or Pennant anticipating strong follow-through.
Recognising and understanding these common patterns can help enhance your trading decisions with clear entry, exit, and stoploss guidelines. Remember, combining pattern signals with volume and other technical indicators improves reliability significantly.
Chart pattern trading holds significant value in Indian markets, particularly because of the unique characteristics of stock exchanges like the National Stock Exchange (NSE) and the Bombay Stock Exchange (BSE). Indian markets feature a diverse mix of retail investors, institutional players, and a range of sectors, which makes recognising and applying chart patterns a practical way to anticipate market moves. Traders can interpret these patterns to gauge potential trend reversals or continuations, tailoring their strategies to local market behaviour.
Role in NSE and BSE trading
NSE and BSE are two of the largest and most liquid stock exchanges in India, hosting thousands of listed companies with varied market capitalisations. Chart patterns on these exchanges reflect the collective sentiment of millions of participants, including domestic investors and foreign institutional investors (FIIs). For example, a double bottom pattern on a liquid stock like Reliance Industries or TCS can signal a strong buying opportunity, supported by high volumes. Understanding patterns on NSE and BSE trading data allows traders to align their decisions with prevailing trends seen on these platforms.
Liquidity and pattern reliability
Liquidity plays a vital role in the effectiveness of chart patterns. Stocks with high trading volumes tend to produce more reliable patterns since price movements reflect genuine supply-demand dynamics. Illiquid stocks, by contrast, may show distorted patterns caused by sporadic trades or price manipulation attempts. For instance, the Nifty 50 index stocks typically form clearer and more dependable patterns than lesser-known mid-cap or small-cap stocks. Thus, focusing on liquid stocks within NSE or BSE improves the accuracy of pattern-based trading.
Platforms offering chart analysis
Many Indian trading platforms now include advanced charting tools with built-in pattern recognition features. Popular platforms such as Zerodha’s Kite, Upstox, and Angel Broking offer interactive charts, real-time data, and pattern alerts that help traders spot formations like flags, triangles, or head and shoulders. These tools simplify the analysis process, making it easier for traders to scan multiple stocks quickly and execute timely trades. Mobile apps and desktop platforms both support detailed technical analysis, enabling users to analyse patterns anywhere.
Incorporating patterns in trading strategies
Traders often combine chart patterns with other technical indicators like volume, moving averages, or the Relative Strength Index (RSI) for better confirmation before entering trades. For example, spotting a breakout from an ascending triangle on the NSE, supported by increasing volume and a positive RSI trend, can boost confidence in a trade setup. Indian traders frequently use systematic investment plans (SIP) or margin funding alongside pattern-based entries to manage risk and capital efficiently. Integrating patterns within a broader trading strategy aligns with both short-term and swing trading goals.
Applying chart patterns in Indian markets requires understanding local liquidity nuances and utilising popular trading platforms to gain practical insights. This approach helps traders make informed decisions, reducing guesswork in market timing.
Key takeaway: Successful pattern trading in India hinges on selecting liquid stocks from NSE/BSE, using reliable charting platforms, and confirming signals through additional indicators and volume analysis.
Successful chart pattern trading hinges on careful analysis and disciplined execution. Traders must avoid common mistakes and continuously develop their skills to improve accuracy and confidence. This section highlights crucial tips that help refine your approach, minimise losses, and enhance profitability.
One of the biggest mistakes traders make is misinterpreting chart patterns. For instance, confusing a double top with a head and shoulders pattern can lead to wrong entry or exit points. Such errors often occur when traders rush decisions or ignore the pattern’s formation details. It is vital to understand each pattern's specific features and not force a pattern shape onto the chart where it doesn't truly fit.
Failing to properly distinguish between breakout and fake breakout signals is another common issue. A trader might jump in expecting a trend reversal, only to see prices revert quickly, causing losses. Carefully waiting for confirmation signals helps avoid this.
Volume acts as the backbone of pattern validation. A pattern formed on low or declining volume tends to be weak and less reliable. For example, a breakout in the Indian stock market, like in the Nifty 50, accompanied by above-average volume is usually more trustworthy. Without volume confirmation, you risk entering trades that lack follow-through momentum.
Furthermore, confirmation signals such as closing prices beyond pattern boundaries provide better clarity. Entering trades before these confirmations often lead to premature decisions. Integrating both volume and price confirmation into your strategy strengthens decision-making and reduces false signals.
Consulting well-regarded PDFs from established traders provides structured learning and deeper insights into chart patterns. Many Indian traders refer to resources like "Technical Analysis of the Financial Markets" by John Murphy or SEBI publications on technical analysis. Such materials explain pattern recognition, psychology behind market moves, and practical trading rules. Keeping these PDFs handy allows you to revise key concepts frequently and apply them effectively in live markets.
Hands-on practice with charting tools like TradingView, Zerodha Kite, or Upstox Pro is essential. These platforms offer real-time data for NSE and BSE, plus tools to draw, measure, and test patterns. Practising on historical charts helps you backtest patterns and understand their behaviour. Regular use sharpens pattern recognition and timing of trades.
Start with paper trading on these platforms to build confidence without risking capital. Over time, your ability to spot valid patterns and react appropriately improves, making your trading strategy more robust.
Remember, mastering chart pattern trading takes patience and consistent effort. Avoid haste, trust verified signals, and keep learning from reliable resources to trade smarter in Indian markets.
Avoid forcing pattern interpretations; ensure clarity before trading.
Confirm patterns with volume and price movement before entering positions.
Use respected PDFs for foundational knowledge.
Leverage charting tools for practice and real-time analysis.
Taking these tips seriously can make a significant difference in your trading outcomes, especially within the dynamic environment of India’s equity markets.
📊 Learn QX trading basics, strategies, risks, and regulations tailored for Indian investors. Get practical tips to trade safely and effectively today!

Explore Quotex's trading platform features, user interface, security, and payment methods 🔒📱 Ideal guide for traders in India seeking reliable online trading insights 🇮🇳

Explore Quotex web trading platform 🌐, its features, security 🔒, usability, and trading options. Know everything traders in India 🇮🇳 should consider before starting.

Explore Quotex.com with our detailed guide 📊 including features, trading tips, setup, risk management & why it's popular among Indian traders 🇮🇳.
Based on 8 reviews