

Understanding Qutex Trading: Key Insights for Indian Traders
Explore Qutex Trading platform features, fees, and security 🔒 to help Indian traders make informed choices 🇮🇳. Compare brokers and get tips for success.
Edited By
Charlotte Evans
The Deep Crab pattern is one of the less common but highly precise harmonic price patterns in technical analysis. Traders use it mainly to spot potential reversals in both equity and commodity markets. This pattern identifies strong turning points by combining specific Fibonacci ratios, which makes it unique compared to other price patterns.
Deep Crab itself builds on classic harmonic structures but stands out due to its deep retracement points. Typically, it involves price movements where the final leg extends much beyond the usual levels seen in similar patterns like the Gartley or Bat patterns. For example, where a Bat pattern might see a retracement near 0.886, the Deep Crab expects a final move reaching a 1.618 extension of the initial leg.
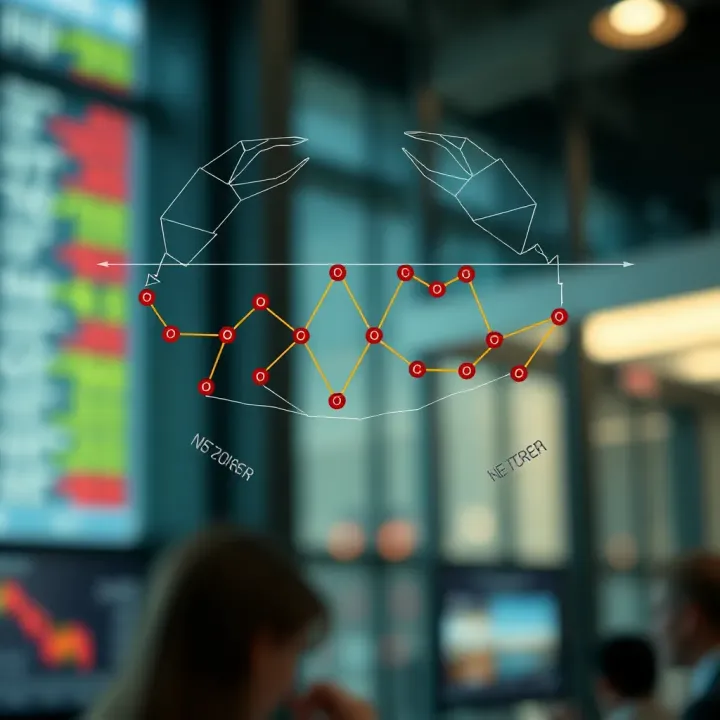
Identifying the Deep Crab pattern accurately can improve entry timing and risk management in trading decisions.
This pattern consists of five key points labelled X, A, B, C, and D:
XA: The initial price move
AB: Retracement of XA, usually between 0.382 and 0.618
BC: Extension or retracement of AB, often around 0.382 to 0.886
CD: The defining leg, stretching 1.618 times beyond point XA
Recognising these price points correctly allows traders to forecast possible market reversals at point D. The combination of Fibonacci extensions and retracements offers an edge when markets are consolidating or nearing exhaustion.
In the Indian stock market or commodities like crude oil and gold, the Deep Crab pattern can serve as a useful tool due to the volatility and quick swings experienced during festive seasons or economic events. For instance, during budget announcements or RBI monetary policy updates, spotting such harmonic patterns can help anticipate price corrections or breakouts.
In short, learning to detect the Deep Crab pattern adds precision to technical analysis and complements other trading tools like moving averages or RSI (Relative Strength Index). The rest of the article will break down how to identify this pattern clearly, its strengths, limitations, and practical tips for trading in both Indian and global markets.
The Deep Crab pattern is a valuable tool for traders looking to spot potential market reversals with precision. Understanding this pattern helps investors predict price movements based on specific structural and Fibonacci relationships, offering practical advantages in timing entry and exit points. For instance, in the Indian stock market, using the Deep Crab pattern on NSE stocks like Reliance Industries or Tata Steel can enhance the accuracy of anticipating trend reversals during volatile phases.
Applied correctly, this pattern reduces guesswork by providing a repeatable framework to evaluate price action. It's particularly useful when markets show sharp corrections followed by accelerated moves, common in commodities and equities. Knowing the pattern’s distinct markers prepares traders to act with confidence.
Definition and Purpose
Harmonic patterns are advanced chart formations that use geometric price structures combined with Fibonacci ratios to identify high-probability reversal zones. Unlike simple trendlines or moving averages, harmonic patterns pinpoint specific levels where price is likely to reverse, based on market psychology and natural retracements. Traders rely on them to plan trades that align with both price action and math-based support or resistance.
In practice, recognising harmonic patterns can clear ambiguity around when to enter or exit. For example, during the 2023 market swings in NSE, traders who identified harmonic formations could better manage risks by aligning trades with these critical zones.
Common Types of Harmonic Patterns
Several harmonic patterns have gained popularity like Gartley, Bat, Butterfly, and Crab, each with unique proportions but sharing the principle of Fibonacci-based price structures. The Gartley and Bat patterns mainly indicate moderate reversals, while the Crab pattern typically signals deeper retracements.
These patterns are relevant across asset classes—from Indian equities to commodities like gold and crude oil—making them versatile. A trader analysing Nifty 50 often encounters these formations, which can aid in precise timing, especially with volatile headline events.
Key Features
The Deep Crab stands out for its extreme retracement levels, especially the point D, which goes beyond the usual boundaries seen in basic Crab or other harmonic patterns. This results in larger price swings rendering higher reward potential but also requiring strict risk management.
For example, in the bond market or currency pairs traded by Indian investors, the Deep Crab's structure reveals pronounced extensions that often mark strong reversals, making it both challenging and rewarding to trade.
The Role of Fibonacci Ratios
Fibonacci ratios form the backbone of the Deep Crab's structure. The pattern usually features a sharp 1.618 extension from the initial XA leg, a rarity compared to other patterns. This ratio defines the ‘deep’ part of the pattern, helping traders forecast reversal zones with better accuracy.
Applying these ratios in charting tools, especially when analysing NSE or BSE instruments, brings clarity to potential buy/sell levels. These Fibonacci numbers aren’t random but reflect natural market cycles, and the Deep Crab capitalises on this for a strategic edge.
Mastering the Deep Crab pattern requires understanding its relationship with Fibonacci ratios and recognising its unique structure. This knowledge can boost one's ability to predict significant market turns confidently.
Understanding the structure and accurate identification of the Deep Crab pattern is essential for traders aiming to spot precise reversal points in the market. This pattern’s effectiveness largely depends on recognising its specific leg formations and validating them through Fibonacci ratios. Clear identification helps traders avoid false signals and enhances timing for entry or exit.
The Deep Crab pattern consists of four legs labeled XA, AB, BC, and CD. The XA leg starts the pattern with a sharp price move, which is followed by a retracement AB that typically reverses around 38.2% to 61.8% of XA. Then, the BC leg retraces part of AB but remains shorter in length. Finally, the CD leg extends significantly beyond the original XA move, reaching the 'deep point'. The integrity of these legs in both size and angle helps traders visually spot where the pattern forms.
For example, if the XA leg in a stock chart moves up sharply from ₹500 to ₹700, the AB leg might retrace back to around ₹600, and BC shifts price back up to ₹650 before the CD leg pushes well beyond ₹700, signalling the deep claw of the pattern. These carefully measured movements create the structure that defines the Deep Crab.
The deep point refers to the endpoint of the CD leg, where the pattern suggests a strong reversal zone. Unlike other harmonic patterns, the Deep Crab’s CD leg extends notably farther, often retracing between 224% and 361.8% of the BC leg. This extreme move signals that the market has potentially overextended itself, making this area crucial for traders to watch for buying or selling opportunities.
In practical terms, after the CD leg completes at this extended level, traders expect a correction or reversal. Identifying this point correctly means watching the pattern unfold across price swings and confirming with Fibonacci measurements.
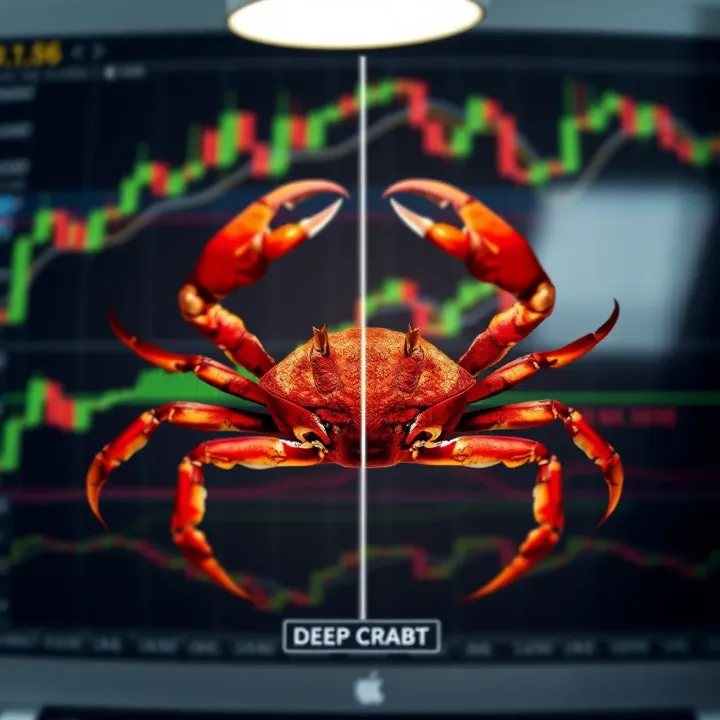
Fibonacci levels are the backbone of identifying the Deep Crab. Retracements measure how much price pulls back during AB and BC legs relative to XA and AB respectively. Extensions calculate how far the CD leg stretches beyond BC. Understanding these specific ratios allows traders to differentiate the Deep Crab from similar patterns.
For instance, using Fibonacci retracement tools on a digital charting platform, one could check if AB retraces 0.382 or 0.618 of XA, and if CD extends anywhere from 2.24 to 3.618 times BC. Precise calculations reduce guesswork and clarify entry or exit points.
Key ratios defining the Deep Crab include: AB leg retracing between 38.2% to 61.8% of XA; BC leg retracing between 38.2% to 88.6% of AB; and significantly, the CD leg extending 224% to 361.8% of BC. The depth of the CD leg’s extension is what sets this pattern apart from others like Bat or Gartley.
These numbers serve as a checklist for traders. If these ratios align on the chart, the chance is high that the pattern is a valid Deep Crab formation, and traders can prepare strategies accordingly.
Accurate recognition of the Deep Crab’s structure and Fibonacci benchmarks dramatically improves trading precision, especially in volatile markets like Indian equities and commodities.
Clear identification and understanding of the Deep Crab’s elements translate directly into better trading outcomes, by signalling high-probability reversal points backed by mathematical proportions. This precision is why many technical analysts in India and abroad pay close attention to this pattern when planning trades.
Trading strategies built around the Deep Crab pattern help traders spot potential market reversals and define clear entry and exit points. Since this pattern is identified using specific Fibonacci ratios, it offers precise levels to time trades. For Indian traders dealing with equities or commodities on NSE and BSE, these strategies provide a disciplined approach rather than relying on guesswork or pure instinct.
The foundation of trading the Deep Crab lies in recognising when a trend is about to reverse. The pattern's final point, known as the 'D' point, appears after a deep retracement and an extended Fibonacci extension—often 161.8% or more of the prior leg. When price action reaches this deep point, it usually signals an overextended move and hints at an imminent reversal. For example, if Reliance Industries Ltd stock approaches the deep Crab's completion zone after a prolonged rally, traders watch closely for bearish reversal signs like candlestick patterns or volume spikes.
This early recognition allows traders to enter positions ahead of the market correction or bounce. However, confirmation through momentum indicators like RSI (Relative Strength Index) or MACD (Moving Average Convergence Divergence) is useful to avoid false signals.
Once a reversal is identified at point D, setting realistic price targets becomes essential for managing trades. Typically, the primary targets are drawn from Fibonacci retracement levels of the entire pattern, such as 38.2%, 50%, and 61.8% of the CD leg. For instance, if a trader enters a short position in Tata Steel Ltd at the deep Crab's D point, the first profit booking can happen near 38.2% retracement of the CD move.
Setting multiple targets allows gradual profit booking and reduces the risk of holding trades too long during volatile conditions common in Indian market sessions. Using trailing stops near these levels also helps capture the upside if momentum is strong.
Placing a stop-loss is critical to protect capital if the pattern fails. For a Deep Crab trade, the stop-loss usually goes beyond point D, allowing some buffer for price fluctuations. For example, if UltraTech Cement reaches point D and you enter a long position, setting the stop-loss slightly below D's low ensures you limit losses when the expected reversal does not materialise.
This approach guards against whipsaws common in Indian volatile markets, especially during festivals or budget announcements where unexpected news moves markets swiftly. A tighter stop-loss may lead to premature exits, while a wider one increases risk, so balancing this depends on the trader’s style and risk appetite.
Risk management also involves selecting the right position size based on stop-loss distance and total capital risk tolerance. Using the Deep Crab pattern, a trader should calculate the monetary risk from entry to stop-loss and size the position accordingly. For example, if Rs 10,000 risk is acceptable on a trade with a Rs 5 move between entry and stop-loss, the trader should buy 2,000 shares (10,000 ÷ 5) to keep losses manageable.
This ensures that no single trade can erode a large chunk of capital and keeps the trader in the game long term. Position sizing also helps during sudden volatility spikes, common in Indian markets during quarterly results or global events.
Effective trading with the Deep Crab pattern demands discipline in entering at key reversal points, setting price targets methodically, and managing risks with appropriate stops and position sizes. This structured approach turns pattern recognition into actionable strategies.
Understanding how the Deep Crab differs from and relates to other harmonic patterns helps traders select the most suitable setups for their strategies. Unlike general chart patterns, harmonic patterns rely heavily on precise Fibonacci ratios, so even slight differences can affect trade timing and risk management. Comparing the Deep Crab with other formations like the basic Crab, Bat, and Gartley provides more context about its unique qualities and limitations.
The Deep Crab is essentially an extended version of the basic Crab, distinguished by its deeper retracement at the 'B' point. While the traditional Crab's B point typically retraces around 38.2% to 61.8% of the XA leg, the Deep Crab extends this retracement close to 88.6%, creating a more pronounced pullback. This extension means the Deep Crab usually signals a stronger potential reversal but also requires greater patience, as price reaches more extreme levels.
Another key difference lies in the CD leg's Fibonacci extension. In the Deep Crab, the CD leg often reaches 161.8% Fibonacci extension or more of the BC leg, whereas the basic Crab might stop at 127.2% or 138.2%. This produces a sharper 'V-shaped' reversal opportunity, often associated with high reward-to-risk setups. For example, on the NSE or BSE, a Deep Crab pattern in stocks like Reliance Industries or Tata Steel may highlight deep retracements during market corrections, offering traders clearer entry points.
While the Deep Crab extends deeply into Fibonacci levels, the Bat and Gartley patterns have relatively shallower retracements and different leg proportions. The Bat pattern features a B point retracement of the XA leg near 50%, and the CD leg tends to reach a 88.6% retracement of the initial XA leg, making it less aggressive than the Deep Crab. Conversely, the Gartley shows a B point around 61.8% and a CD leg that is a 78.6% retracement, creating a more moderate setup.
These differences affect trade timing and the kind of market movement expected. The Deep Crab signals sharper reversals, while the Bat and Gartley predict more gradual turns. Practically, this means the Deep Crab can be useful when trading volatile stocks or indices during strong swings, whereas the Bat and Gartley might suit range-bound or steadier markets.
When choosing between these patterns, consider market conditions and your risk appetite; the Deep Crab offers high returns but demands careful validation with other indicators.
Overall, understanding these contrasts improves pattern recognition and execution efficiency, which is especially valuable in Indian markets where volatility and momentum vary across sectors and instruments.
Trading using the Deep Crab pattern demands careful consideration of its challenges and limitations. While it offers clear guidelines based on Fibonacci ratios, the pattern is not foolproof. Traders need to understand where it can mislead and how to minimise risks.
False signals are a common hurdle with the Deep Crab pattern. This pattern forms in highly volatile markets, so price swings might mimic the pattern without following through. For instance, during a sharp market correction in the Nifty 50, the Deep Crab structure may seem to appear, but the final leg could overshoot or undershoot critical Fibonacci levels, invalidating the pattern’s predictive power. Such false positives often result in premature entries or exits, leading to losses.
Another reason for false signals is the inaccurate identification of key points like the "deep point" in leg CD, which is crucial for this pattern. Without precise measurement, traders might mistake normal retracements for the Deep Crab. Additionally, overlapping or noisy data in intraday charts can cause confusion when spotting the pattern, especially for those relying on automated charting tools alone.
False signals in harmonic patterns can drain capital quickly. It is essential to cross-check the pattern formation on multiple timeframes before making trading decisions.
Due to the risk of false signals, using confirming indicators alongside the Deep Crab pattern is vital. Momentum oscillators like RSI (Relative Strength Index) or MACD (Moving Average Convergence Divergence) can help verify if a reversal is gaining strength near the pattern’s completion. For example, if the Deep Crab pattern suggests a bullish reversal but RSI remains in an oversold region, it adds weight to the trade setup.
Volume analysis also plays a role. A rise in trade volume near the pattern’s reversal point supports the likelihood of a sustained move. In Indian markets, volume spikes around levels identified through the Deep Crab can be particularly revealing due to participation from retail and institutional investors.
Combining the Deep Crab pattern with support and resistance levels from price action analysis further strengthens decision-making. Confirming that the pattern aligns with a significant support zone on BSE stocks or NSE derivatives often improves trade success rates.
In short, no harmonic pattern, including the Deep Crab, should be used in isolation. Confirming signals from other technical tools underpin a more reliable strategy and protect against costly mistakes.
Technical analysis tools like the Deep Crab pattern find significant relevance in Indian trading environments, where both retail and institutional investors actively seek reliable methods to predict market turns. The pattern's distinctive Fibonacci alignment helps traders anticipate strong reversals, making it particularly useful given the volatility often seen in Indian equities and commodities markets.
In Indian equities trading, the Deep Crab pattern can highlight potential reversal points during price corrections in stocks listed on the National Stock Exchange (NSE) and Bombay Stock Exchange (BSE). For instance, when a fundamentally robust company such as Reliance Industries or Tata Steel undergoes a sharp pullback, spotting a Deep Crab pattern on their daily charts could alert traders to prepare for a bounce or further decline. This pattern helps traders avoid jumping into trades too early during a correction and instead enter positions closer to trend reversals.
Commodities trading in India, including gold, crude oil, and base metals, also benefits from this pattern. Prices of commodities like gold, which is widely traded on platforms like Multi Commodity Exchange of India Ltd (MCX), often move in waves which harmonic patterns capture well. Recognising a Deep Crab pattern here assists commodity traders in timing their buy or sell decisions, improving returns in markets where fundamental shifts can be sudden and sharp.
Applying the Deep Crab pattern to NSE and BSE instruments requires familiarity with specific price action and volume data unique to Indian markets. Using charting platforms such as Zerodha’s Kite, Upstox Pro, or TradingView India, traders can plot Fibonacci ratios accurately to identify the Deep Crab formation on stock, index, or derivative instruments.
Active margin and derivative traders benefit most because the Deep Crab can indicate optimal entry points for futures and options trades. For example, when Nifty 50 or Bank Nifty futures exhibit the Deep Crab pattern at critical support levels, traders can take leveraged positions with defined stop-loss, limiting downside risk. It is equally crucial to combine this pattern with other Indian market factors like quarterly earnings results, RBI policy decisions, or global cues impacting capital flows.
The deep crab’s potential lies in its precision of setting reversal zones, which is particularly valuable in Indian markets known for sudden news-driven spikes and dips.
To sum up, the Deep Crab pattern proves practical for Indian traders by providing a structured approach to price reversal anticipation. When used alongside other indicators and market context, it can sharpen trading decisions across equities and commodities on NSE and BSE platforms.
Identifying the Deep Crab pattern accurately demands the right tools and resources, especially if you want to trade with confidence rather than on hunches. This pattern, with its precise Fibonacci ratios and complex structure, can be tricky to spot manually. Hence, using dedicated charting software and educational resources helps traders reduce errors and increase the chances of profitable decisions.
Modern charting platforms now come equipped with tools that automatically detect harmonic patterns, including the Deep Crab. For example, software like TradingView, MetaTrader 5, and NinjaTrader include plugins or built-in features to highlight these patterns on live market charts. This saves traders hours of manual calculation and visual inspection, especially for instruments listed on the NSE or BSE.
These platforms identify key price swings and overlay Fibonacci extensions and retracements, marking potential Deep Crab patterns with alerts. The practical benefit is immediate: once the software flags a valid pattern, traders can quickly assess entry points, stop-loss levels, and targets. Many Indian retail traders combine these tools with their favourite brokerage platforms for streamlined executions.
That said, reliance solely on automated detection isn't foolproof. Some software might highlight false positives, so cross-checking with manual Fibonacci measurements can reinforce confidence.
Apart from software, accessing quality educational content plays an important role in mastering the Deep Crab pattern. Comprehensive guides, video tutorials, and webinars from recognised Indian financial education portals equip traders with the theory behind harmonic patterns and practical tips on implementation.
Platforms like NSE India Academy, Elearnmarkets, and Investopedia cover deep-dive lessons into harmonic trading, including real market examples. Meanwhile, trading communities on platforms like TradingView forums, StockTwits, and Indian WhatsApp groups provide peer insights and pattern spotting discussions. These forums also expose traders to varying market conditions, helping them understand when the pattern works best.
Leveraging both technology and collective knowledge offers the Indian trader a distinct edge in navigating complex patterns like the Deep Crab.
In summary, combining the use of sophisticated charting software for pattern recognition with continuous learning through reliable educational resources and active community engagement makes identifying and trading the Deep Crab pattern more manageable and efficient. This approach reduces guesswork and improves decision-making in the fast-moving Indian markets.
Explore Qutex Trading platform features, fees, and security 🔒 to help Indian traders make informed choices 🇮🇳. Compare brokers and get tips for success.
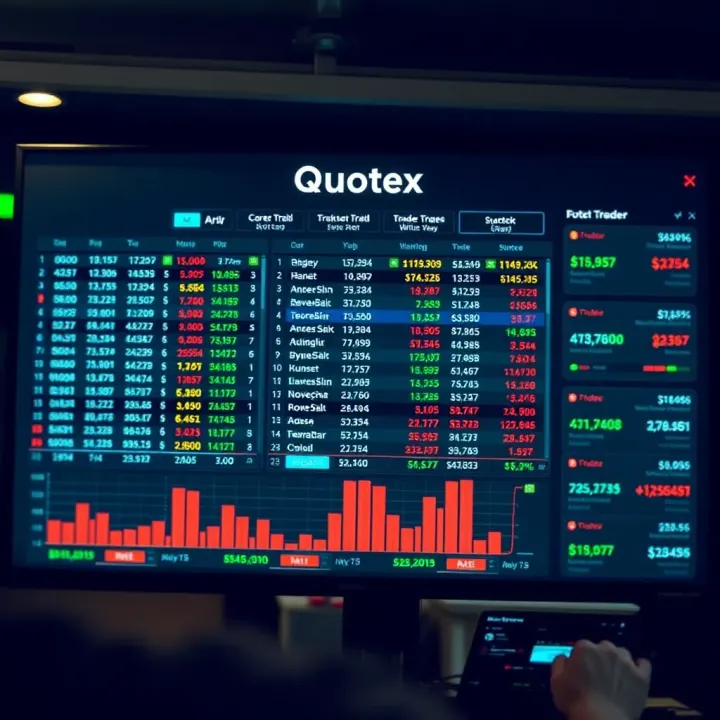
📈 Explore how the Quotex leaderboard ranks traders, what affects scores, and practical tips to boost your position for smarter trading decisions.

Explore Qutoex📚: Understand its origins, uses, challenges, and impact today. Get a detailed, practical guide to Qutoex for every context.

Explore Qutex's key features, uses, and future potential in India’s tech scene. Gain insights into its benefits, limits, and role in modern innovation 💡📱.
Based on 15 reviews