
Master Chart Analysis on TradingView for Indian Traders
📈 Learn how Indian traders can master TradingView’s chart tools, customise layouts, and apply technical indicators for smarter, informed market decisions in India 🇮🇳.
Edited By
Oliver Hayes
TradingView.com has become a go-to platform for traders and investors, particularly in India, who want an accessible yet powerful way to analyse the markets. Its charting tools offer detailed visual insights into price movements, enabling you to spot trends and make smarter decisions. But the platform’s features can seem overwhelming at first, especially if you’re just starting out.
This guide breaks down the essentials of using TradingView charts so you can get right to analysing stocks, commodities, or currencies with confidence. From setting up your chart to adding indicators and drawing tools, every step focuses on practical use. For example, Indian traders often use moving averages and volume indicators on Nifty 50 stocks to time entries and exits, and TradingView makes this straightforward.
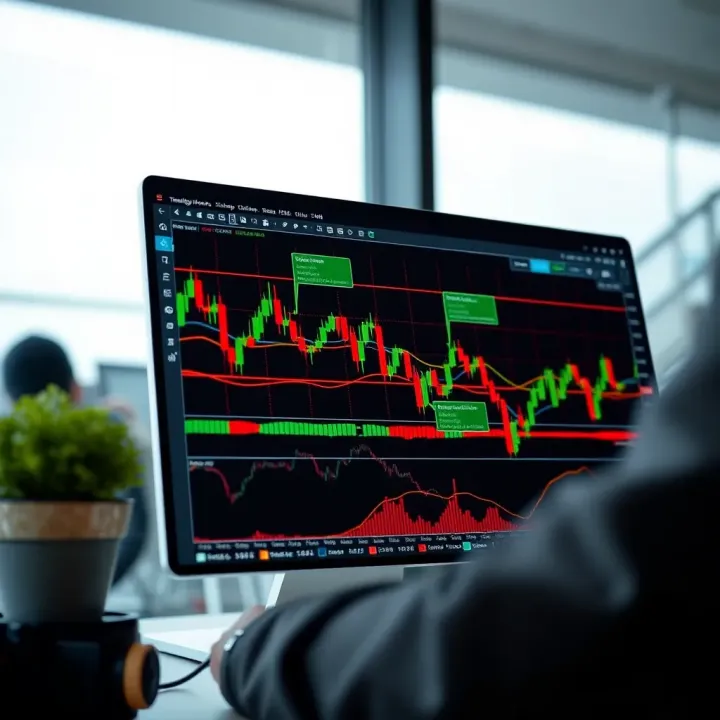
Before diving into complex features, it helps to know how to customise the chart layout according to your style. You can switch between candlestick, bar, or line charts, adjust timeframes from minutes to months, and modify colour schemes for clarity—important when trading late night or during monsoon months when light conditions at home may vary.
One useful tip is to save your chart templates on TradingView so you don’t have to recreate your frequently used setups every day. This saves precious time, especially during volatile market hours.
Whether you are analysing trends, identifying support and resistance with drawing tools, or setting alerts for price changes, this guide will cover everything step-by-step. Plus, it explains how to share your charts with clients or colleagues, making it handy for advisors and analysts working collaboratively.
The next sections will explore each feature in detail, ensuring you maximise TradingView.com’s potential for your trading strategies.
Getting started with TradingView's chart is the first step for traders aiming to analyse the markets efficiently. This section covers essential basics, helping you get comfortable with the platform’s core features. A smooth introduction ensures you avoid common pitfalls and makes the journey through advanced tools easier.
Signing up for a TradingView account is straightforward and necessary if you want to save your work, access personalised settings, and receive real-time data. Registration requires only an email or social media login. Indian traders benefit from signing up since TradingView offers market data for NSE, BSE, and also currency pairs relevant to the Indian economy.
Having an account also unlocks more features like alerts and multiple watchlists, which free users cannot access fully. For example, storing your preferred indicators or chart layouts will save time next time you log in, especially helpful for active investors tracking Sensex or Nifty movements.
Once logged in, the chart area is just a click away from the TradingView dashboard. Traders often miss that the chart module is separate from the idea publishing or screener sections and is found by clicking ‘Chart’ in the top menu bar. It loads a clean, responsive interface tailored for technical analysis.
Quick access is important, especially during volatile market hours when each second counts. For Indian markets, which tend to be busy during opening and closing bells, reaching the chart section fast allows reacting promptly to live price action.
The chart interface itself is intuitive yet rich in options. The main panel displays price data with a toolbar alongside for adding indicators, drawing tools, and changing chart settings. On the right side, you have watchlists and alert notifications, while the bottom shows the timeline and volume.
For example, a day trader tracking nifty futures might use the bottom timeline to switch from 1-minute to 5-minute charts, spotting quick price swings. Familiarising yourself with this layout helps you avoid hunting for tools mid-trade.
TradingView offers several chart types to suit different trader preferences. Candlestick charts remain the favourite for many because they reveal price movements within a timeframe clearly, showing open, high, low, and close prices.
Bar charts provide similar info but use bars instead of candlesticks, while line charts plot simple closing prices over time, useful for a cleaner, overall trend view. For instance, a long-term investor may prefer line charts to track broader market trends, while a swing trader depends on candlesticks for entry signals.
Timeframes matter and TradingView lets you pick from seconds up to monthly views. Day traders might switch between 1-minute and 15-minute charts to catch short-term movements, while positional traders focus on daily or weekly charts.
By adjusting timeframes, you tailor the chart to your strategy. For example, spotting a support level on a weekly chart while confirming entry on a 15-minute chart combines broad and detailed views.
Working with colour schemes that suit your eyes helps reduce fatigue during long sessions. TradingView provides preset light and dark themes, plus options to customise candlestick colours. Indian traders watching markets in poor lighting, like during power cuts, may find the dark theme easier.
Layouts let you save how your charts look and which tools are active. If you analyse multiple stocks or currencies, saving distinct layouts speeds up switching context. For example, keeping a layout for NSE stocks and another for forex pairs means you don’t have to set up indicators every time.

Getting familiar with TradingView’s basic features prepares you to use its advanced analysis tools confidently. Starting well saves time and makes trading decisions sharper.
Technical analysis tools lie at the heart of TradingView's charting platform. These tools help traders and investors spot trends, assess market momentum, and time their trades better. Rather than relying solely on news or gut feeling, analysing price patterns with well-tested techniques gives a sharper edge in the market.
Popular indicators like Moving Averages, Relative Strength Index (RSI), and Moving Average Convergence Divergence (MACD) help simplify complex market data into actionable insights. For instance, Moving Averages smooth out price fluctuations to reveal the underlying trend—simple moving averages (SMA) over 50 and 200 days are favourite choices among many traders. RSI measures momentum and identifies overbought or oversold conditions, handy for spotting possible reversals in stocks such as Reliance or TCS. MACD highlights changes in momentum and often signals buying or selling points.
You can add multiple indicators on a TradingView chart to get a more comprehensive view of the market. For example, combining Moving Averages with RSI can confirm trend direction and strength simultaneously. TradingView makes it easy to configure these indicators—changing parameters like time period or type to suit your trading strategy. This flexibility helps traders adapt to various markets, whether equities, commodities, or forex.
Setting alerts based on indicator signals is especially useful for active traders juggling multiple charts. You can programme alerts to notify you when RSI crosses a certain level or when MACD shows a bullish crossover. Such alerts mean you don't have to stare at the screen all day but remain ready to act at the right moment. This saves time and reduces missed opportunities.
Drawing trend lines and marking support and resistance levels help identify key price zones where buying or selling pressure intensifies. On TradingView, you can draw these lines directly on charts, making it clear where the stock might face hurdles or find support. For instance, in the Nifty 50 chart, marking support zones around 17,000 and resistance near 18,000 helps traders plan entries or exits.
Fibonacci retracements and extensions provide precise levels traders watch for price reversals or continuation. Applied on recent price swings, these tools highlight natural points based on mathematics where markets often pause or bounce. This helps in setting realistic targets or stop losses, improving trade risk management.
Annotations and text notes allow you to record observations or trading ideas directly on the chart. For example, noting "Watch for breakout on volume above 1 lakh shares" keeps your plan clear during fast markets. These personal notes improve discipline and help review past trades effectively.
Mastering TradingView's technical tools not only sharpens your market reading but also supports smarter, more disciplined trading decisions.
By using these features thoughtfully, traders can better navigate price action and improve their chances of success in Indian markets and beyond.
Advanced chart features on TradingView play a key role in helping traders make more informed decisions. These tools offer added flexibility to analyse markets from various perspectives, which is especially useful when following volatile stocks or currency pairs. Using such features efficiently can help spot trends early, compare asset movements, and personalise your workspace for quicker reactions.
Multi-chart layouts allow you to view several charts on a single screen. This is particularly useful if you want to compare different stocks, commodities, or forex pairs at the same time. For example, an equity trader following Nifty stocks might keep separate charts open for Reliance Industries, Tata Steel, and HDFC Bank, each with its own time frame and indicators. This arrangement makes it easier to detect inter-market relationships and spot trading opportunities without switching tabs constantly.
Setting up a multi-chart layout is straightforward on TradingView. You can choose between two, four, or even eight charts on one screen depending on your subscription plan. Each chart remains fully interactive, so you can apply different technical indicators, draw trendlines, or zoom into specific timeframes independently.
Once you have arranged your charts the way you like—whether it’s multiple asset comparisons or a detailed view of a single market—TradingView lets you save this layout for future use. This helps save time, especially if your trading strategy involves regular review of specific assets or indicators.
For example, a trader focusing on gold and crude oil prices might set up a layout with hourly charts for both. By saving this setup, they can return the next day and start analysing without rebuilding from scratch. This feature ensures you stick to your preferred workflow and keep tracking your watchlist easily.
The TradingView screener is a powerful feature that filters securities based on customised criteria such as price movements, volume, technical indicators, or fundamental data. Indian traders can narrow down their search to NSE or BSE stocks by applying parameters like market cap, sector, or recent news impact.
For example, if you want to find all stocks on NSE that have a Relative Strength Index (RSI) below 30, indicating oversold conditions, the screener will list them quickly. This saves hours spent scanning individually and helps you focus on potentially profitable trades.
Besides equities, the screener also covers commodities and forex pairs. This allows you to switch between markets depending on where the opportunity lies.
Alerts keep you updated on key market moves without needing to watch screens all the time. TradingView offers custom alert options based on price levels, indicator values, or drawing tool crossings.
For instance, you can set an alert to notify you when Nifty crosses the 18,000 mark or when the MACD line crosses its signal line for a buy or sell signal. Alerts can be configured to send notifications through app pop-ups, emails, or SMS, helping you react promptly even while on the move.
Together, these advanced features empower traders to streamline their analysis and act swiftly, enhancing overall trading precision and efficiency.
Efficient use of multi-chart layouts, combined with screening and alert tools, can transform your TradingView experience from basic charting to a robust trading command centre.
Sharing and collaborating through TradingView charts offers significant advantages to traders and analysts. It enables seamless communication of market insights, strategies, and data with peers or followers. For both seasoned traders and new entrants across Indian markets, leveraging TradingView’s sharing features can enhance transparency and invite constructive feedback, improving decision-making.
Saving chart snapshots for future reference involves capturing a static image of your current chart setup, including all indicators, drawings, and timeframes. This feature proves useful when you want to review your analysis later or compare market movements over time without the need to log back into TradingView. For example, a trader following Nifty 50 trends might save specific snapshots during volatile sessions to study price behaviour after the fact.
Exporting chart data for external analysis goes a step further, allowing you to download raw data points such as open, high, low, close prices, and volume in formats like CSV. This helps traders who rely on customised spreadsheets or third-party software to conduct deeper statistical analysis or automated backtesting. An analyst preparing detailed reports for institutional clients may find this invaluable when combining TradingView data with other datasets for enhanced accuracy.
Publishing ideas and charts on TradingView lets you showcase your market outlook and strategies with the platform’s community. By posting annotated charts or trade setups, traders gain exposure and invite discussion, which can confirm or challenge their analysis. Active contributors in Indian trading groups, for instance, often publish charts highlighting technical setups on stocks like Reliance or Tata Motors, fostering vibrant knowledge exchange.
Embedding charts on blogs and social media provides a practical way to extend your insights beyond TradingView itself. Whether you run a financial blog or maintain an active Twitter profile, embedding interactive charts engages your audience with live, real-time data. This feature caters well to market educators and advisors who want to demonstrate trends and strategies visually, making complex information accessible for followers.
Effectively sharing and collaborating via TradingView charts enriches your trading experience and broadens your network. It strengthens learning and offers new angles on market behaviour, vital in India’s fast-evolving financial landscape.
Making the most out of TradingView charts means tailoring the platform to fit your trading habits and the markets you follow. Especially for traders in India, adapting chart settings to local market nuances can improve analysis accuracy and decision-making speed. This section breaks down simple yet effective tips that help you customise TradingView charts, optimise their performance, and keep the visual experience clear.
TradingView supports Indian stock symbols and indices like Nifty 50, Sensex, and sectoral indices from NSE and BSE. Make sure to select the right exchange and symbol for your trades to avoid confusion. For instance, instead of generic stock tickers, use specific codes like NSE:TCS or BSE:RELIANCE to get real-time, precise data for Indian companies.
This approach helps in analysing relevant market trends, sector movements, and price actions with local context. It is especially useful for intraday traders and investors focusing on India’s stock environment. Plus, if you track commodities or forex pairs popular locally—such as MCX Gold or USD/INR—these precise symbol choices matter.
TradingView lets you adjust your chart’s time zone to Indian Standard Time (IST), which is UTC+5:30. Setting this properly ensures your candlesticks and indicators align with Indian market opening (9:15 am IST) and closing hours (3:30 pm IST). Incorrect time settings can skew your analysis, such as showing price moves during Indian market off-hours as actual trading activity.
You can also configure session timings to match NSE or BSE market hours. This is helpful to highlight active trading periods and avoid misleading signals outside market times. For example, setting the chart to only show Indian market hours lets you focus on local volatility and avoid noise from international sessions.
Too many indicators, drawings, and alerts can crowd your chart, making it hard to spot key levels or trends. Focus on essential tools that suit your strategy. For example, if you rely on moving averages and RSI, avoid loading extra indicators like Bollinger Bands or MACD unless they add value.
This minimalism improves chart loading time and accuracy when analysing candles. Traders should also hide unused drawing tools to keep charts clean. A tidy layout helps you make faster, sharper decisions without getting distracted by unnecessary clutter.
TradingView offers numerous keyboard shortcuts to speed up chart navigation and tool access. Familiarise yourself with common hotkeys for switching chart types, zooming, and toggling indicators. For instance, pressing "Alt+Right" quickly moves forward one candle, helping day traders scan data swiftly.
Using shortcuts reduces mouse reliance, letting you adjust charts on the fly during fast market moves. You can customise these hotkeys in settings for quicker access to frequently used tools, making TradingView a more responsive platform for Indian market trading.
Pro tip: Regularly review your chart setup and shortcuts every few weeks. This helps adapt to changing market conditions and trading strategies.
📈 Learn how Indian traders can master TradingView’s chart tools, customise layouts, and apply technical indicators for smarter, informed market decisions in India 🇮🇳.
📊 Learn how to trade binary options on TradingView with practical tips, charting techniques, technical indicators & risk management tailored for Indian traders.

🔐 Master ExpertOption login with ease! Learn step-by-step process, fix common issues, and secure your trading account. Manage access across mobiles, laptops safely.
📈 Learn how to spot key chart patterns and trade effectively in Indian markets. Get clear explanations, common pitfalls, and handy PDF resources for confident trading.
Based on 5 reviews